
Using synthetic assumptions, this three-year example produces:
- Enterprise value: 2,171.62
- Equity value: 1,991.62
- Implied value per diluted share: 39.83
This example is educational. Its assumptions and outputs don’t represent a real company, price target, or investment recommendation.
Copy the Google Sheets template or download the Excel file.
What an unlevered DCF calculates
An unlevered DCF forecasts free cash flow to the firm (FCFF) before interest and other financing flows. It discounts that financing-neutral cash flow at WACC, which reflects assumptions about the company’s debt and equity funding.
The basic calculation is:
Enterprise value =
Present value of forecast FCFF
+ Present value of terminal value
This approach follows the firm-valuation method described in NYU Stern’s FCFF guidance: forecast FCFF and terminal value are discounted at the cost of capital.
Next, the model converts enterprise value to equity value:
Net debt = Debt - Cash

Equity value = Enterprise value - Net debt

Implied value per share = Equity value ÷ Diluted shares
FCFF begins with operating profit and excludes interest expense:
EBIT = EBITDA - D&A

NOPAT = EBIT × (1 - Cash tax rate)

FCFF =
NOPAT + D&A - Capital expenditure - Increase in net working capital
This structure separates the operating forecast from the cash, debt, and share-count calculations. However, the valuation still depends on capital-structure assumptions through WACC and the enterprise-to-equity bridge.
Set the units and assumptions
The example uses millions of dollars for financial amounts and millions of shares for diluted shares. As a result, the implied value per share is in dollars per share.
All inputs are synthetic:
| Input | Cell | Baseline value |
|---|---|---|
| Latest full-year revenue | G2 | 1,000 |
| Year 1 revenue growth | G3 | 10% |
| Year 2 revenue growth | G4 | 8% |
| Year 3 revenue growth | G5 | 6% |
| Year 1 EBITDA margin | G6 | 20% |
| Year 2 EBITDA margin | G7 | 22% |
| Year 3 EBITDA margin | G8 | 24% |
| D&A as a percentage of revenue | G9 | 3% |
| Capital expenditure as a percentage of revenue | G10 | 5% |
| NWC investment as a percentage of revenue change | G11 | 10% |
| Cash tax rate | G12 | 25% |
| WACC | G13 | 10% |
| Perpetual growth rate | G14 | 3% |
| Cash | G15 | 120 |
| Debt | G16 | 300 |
| Diluted shares | G17 | 50 |
Enter rates as percentages or decimals. For example, enter a 10% WACC as 10% or 0.10, not 10.
The formulas below use commas as argument separators. Some spreadsheet locales require semicolons.
The template doesn’t check whether every cell in G2:G17 contains a number. Spreadsheet arithmetic generally treats blank assumptions as zero. A blank growth cell can preserve revenue, blank cash or debt can be treated as zero, and a blank share count causes B15 to return zero. Check every required input before relying on the valuation.
Build the three-year DCF
1. Forecast revenue and EBITDA
Enter the latest full-year revenue in DCF Model!G2, annual growth assumptions in G3:G5, and EBITDA margins in G6:G8.
Forecast revenue in B2:D2:
B2 = ROUND($G$2*(1+$G$3),2)
C2 = ROUND(B2*(1+$G$4),2)
D2 = ROUND(C2*(1+$G$5),2)
Calculate EBITDA in B3:D3:
B3 = ROUND(B2*$G$6,2)
C3 = ROUND(C2*$G$7,2)
D3 = ROUND(D2*$G$8,2)
The expected results are:
| Year | Revenue | EBITDA |
|---|---|---|
| 1 | 1,100.00 | 220.00 |
| 2 | 1,188.00 | 261.36 |
| 3 | 1,259.28 | 302.23 |
Zero growth preserves the prior year’s revenue. Negative growth is mathematically valid, but it should be supported by the operating forecast.
2. Calculate EBIT and NOPAT
Enter D&A as a percentage of revenue in G9 and the cash tax rate in G12.
Calculate EBIT:
B4 = ROUND(B3-B2*$G$9,2)
C4 = ROUND(C3-C2*$G$9,2)
D4 = ROUND(D3-D2*$G$9,2)
Then calculate net operating profit after tax:
B5 = ROUND(B4*(1-$G$12),2)
C5 = ROUND(C4*(1-$G$12),2)
D5 = ROUND(D4*(1-$G$12),2)
The expected results are:
| Year | EBIT | NOPAT |
|---|---|---|
| 1 | 187.00 | 140.25 |
| 2 | 225.72 | 169.29 |
| 3 | 264.45 | 198.34 |
A 0% tax rate leaves EBIT unchanged. Investigate rates below 0% or above 100% instead of accepting the output without explanation. If EBIT becomes negative, this simplified formula produces a modeled tax benefit. Whether that benefit is usable depends on the company’s tax attributes.
3. Forecast unlevered free cash flow
Enter capital expenditure as a percentage of revenue in G10 and the working-capital assumption in G11.
This model calculates working-capital investment as:
Increase in NWC = Annual revenue increase × NWC percentage
Calculate FCFF in B6:D6:
B6 = ROUND(B5+B2*$G$9-B2*$G$10-(B2-$G$2)*$G$11,2)
C6 = ROUND(C5+C2*$G$9-C2*$G$10-(C2-B2)*$G$11,2)
D6 = ROUND(D5+D2*$G$9-D2*$G$10-(D2-C2)*$G$11,2)
For Year 1:
FCFF =
140.25 + 33.00 - 55.00 - 10.00
= 108.25
For Year 2:
FCFF =
169.29 + 35.64 - 59.40 - 8.80
= 136.73
For Year 3:
FCFF =
ROUND(
  198.34
  + 1,259.28 × 3%
  - 1,259.28 × 5%
  - (1,259.28 - 1,188.00) × 10%,
  2
)
= 166.03
Because the formula uses the rounded NOPAT value of 198.34, it returns 166.03 rather than recalculating NOPAT from unrounded components.
When revenue falls, this method can produce a working-capital release that increases FCFF. Confirm that the treatment reflects expected collections, inventory, and payment behavior.
If the operating forecast must first be linked across the financial statements, see Build a Startup 3-Statement Financial Model. For a longer forecast structure, see Build a 5-Year Projection in Google Sheets.
4. Discount the forecast cash flows
Enter WACC in G13.
For forecast year (t):
Discount factor = 1 ÷ (1 + WACC)^t
Calculate the discount factors in B7:D7:
B7 = ROUND(1/(1+$G$13)^1,6)
C7 = ROUND(1/(1+$G$13)^2,6)
D7 = ROUND(1/(1+$G$13)^3,6)
Now calculate the present value of FCFF in B8:D8:
B8 = ROUND(B6*B7,2)
C8 = ROUND(C6*C7,2)
D8 = ROUND(D6*D7,2)
At a 10% WACC:
| Year | Discount factor | FCFF | Present value |
|---|---|---|---|
| 1 | 0.909091 | 108.25 | 98.41 |
| 2 | 0.826446 | 136.73 | 113.00 |
| 3 | 0.751315 | 166.03 | 124.74 |
Correct a blank, text, or invalid WACC before relying on the valuation. For example, a WACC of -100% creates a zero denominator in the first discount factor.
5. Calculate terminal value
Enter the perpetual terminal growth rate in G14.
The model applies the perpetual-growth formula to the final forecast year’s FCFF:
Terminal value =
Final-year FCFF × (1 + perpetual growth)
÷ (WACC - perpetual growth)
The formula in D9 is:
D9 = IF($G$13<=$G$14,0,ROUND(D6*(1+$G$14)/($G$13-$G$14),2))
With FCFF of 166.03, WACC of 10%, and perpetual growth of 3%:
D9 =
ROUND(166.03 × 1.03 ÷ (10% - 3%), 2)
= 2,443.01
Discount terminal value in D10:
D10 = ROUND(D9*D7,2)
D10 =
ROUND(2,443.01 × 0.751315, 2)
= 1,835.47
Keep G13 greater than G14. If WACC is less than or equal to perpetual growth, the denominator isn’t valid, so the formula returns zero in D9.
That zero isn’t a reliable error flag. It continues through D10 and enterprise value, while a final-year FCFF of zero could also make D9 zero. Check G13 > G14 separately before interpreting any valuation output. The template doesn’t include a separate status cell that blocks an invalid WACC-growth combination.
6. Calculate enterprise value
Add the discounted forecast cash flows and discounted terminal value:
B12 = ROUND(SUM(B8:D8)+D10,2)
The expected calculation is:
Enterprise value =
98.41 + 113.00 + 124.74 + 1,835.47
= 2,171.62
Terminal value accounts for most of the enterprise value in this example. Consequently, the valuation is particularly sensitive to WACC, perpetual growth, and final-year FCFF.
7. Convert enterprise value to equity value
Enter cash in G15, debt in G16, and diluted shares in G17.
Calculate net debt, equity value, and implied value per share:
B13 = ROUND($G$16-$G$15,2)
B14 = ROUND(B12-B13,2)
B15 = IF($G$17=0,0,ROUND(B14/$G$17,2))
The calculation is:
Net debt =
300 - 120
= 180.00

Equity value =
2,171.62 - 180.00
= 1,991.62

Implied value per share =
1,991.62 ÷ 50
= 39.83
If cash exceeds debt, net debt becomes negative, which increases equity value in this calculation. Cash, debt, debt-like items, and diluted shares should all reflect the same valuation date.
Review the completed workbook
The complete model occupies DCF Model!A1:G17.
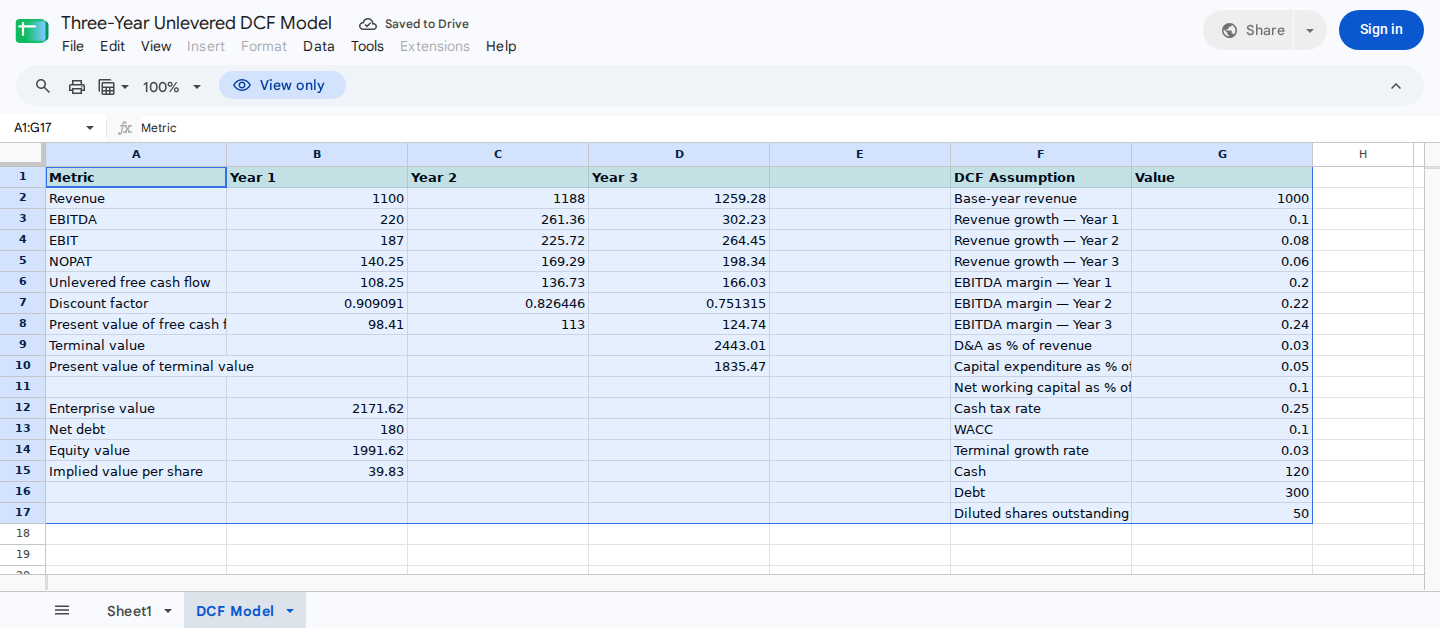
A compact unlevered DCF with local assumptions, discounted cash flows, terminal value, and implied value per share.
Follow this sequence to reproduce the example:
- Enter the latest full-year revenue in
DCF Model!G2. - Enter annual revenue growth in
DCF Model!G3:G5and EBITDA margins inDCF Model!G6:G8. - Enter D&A and capital expenditure as percentages of revenue in
DCF Model!G9:G10. Enter NWC investment as a percentage of revenue change inDCF Model!G11. - Enter the cash tax rate in
DCF Model!G12, WACC inDCF Model!G13, and perpetual growth rate inDCF Model!G14. - Keep
DCF Model!G13greater thanDCF Model!G14; otherwise,DCF Model!D9returns zero and the resulting enterprise value is incomplete. - Enter cash in
DCF Model!G15, debt inDCF Model!G16, and diluted shares inDCF Model!G17. - Review forecast revenue through FCFF in
DCF Model!B2:D6and discounting through terminal value inDCF Model!B7:D10. - Read enterprise value in
DCF Model!B12, equity value inDCF Model!B14, and implied value per share inDCF Model!B15.
The supplied native-spreadsheet execution record produced these baseline results:
| Output | Expected value |
|---|---|
Revenue (B2:D2) | 1,100.00; 1,188.00; 1,259.28 |
FCFF (B6:D6) | 108.25; 136.73; 166.03 |
Discount factors (B7:D7) | 0.909091; 0.826446; 0.751315 |
Discounted FCFF (B8:D8) | 98.41; 113.00; 124.74 |
Terminal value (D9) | 2,443.01 |
Discounted terminal value (D10) | 1,835.47 |
Enterprise value (B12) | 2,171.62 |
Net debt (B13) | 180.00 |
Equity value (B14) | 1,991.62 |
Implied value per share (B15) | 39.83 |
Display formatting may differ, but the underlying results should reconcile to these values.
For artifact identification, the spreadsheet ID is 1nC5itV2YX5PmetlZiz9a7gERVU37GRJVDZwE_eJCz-s. The supplied template SHA-256 is 9b23c06f4dc9aad8b9167aa961f204ecdb70972feaf9830f96194b38a1e1b259, and the screenshot SHA-256 is f70a9ec83b211d2d73ee8435e3ca9b20ac18371859d3ee2a20f1cc83ff379515.
Run the control checks
Reconcile the valuation calculations
Independently recalculate the final outputs:
Enterprise value =
98.41 + 113.00 + 124.74 + 1,835.47
= 2,171.62

Net debt =
300 - 120
= 180.00

Equity value =
2,171.62 - 180.00
= 1,991.62

Implied value per share =
1,991.62 ÷ 50
= 39.83
This check confirms that the discounted cash flows, terminal value, net debt, and share calculation agree.
Test a 12% WACC
Reset the complete baseline, then change only G13 from 10% to 12%.
The supplied execution record produced:
| Output | 10% WACC | 12% WACC |
|---|---|---|
Terminal value (D9) | 2,443.01 | 1,900.12 |
Discounted terminal value (D10) | 1,835.47 | 1,352.47 |
Enterprise value (B12) | 2,171.62 | 1,676.30 |
Equity value (B14) | 1,991.62 | 1,496.30 |
Implied value per share (B15) | 39.83 | 29.93 |
With every other assumption unchanged, the higher discount rate reduces both the terminal value and the present value of the modeled cash flows. The size of that change is specific to these synthetic inputs.
Reset G13 to 10% before running another independent check.
Check the terminal-growth condition
Review G13 and G14 directly. If G14 is equal to or greater than G13, D9 returns zero, and that zero continues into enterprise value.
Don’t interpret the resulting enterprise value as a valid DCF output. Restore a WACC above perpetual growth and recalculate. Because a legitimate zero terminal cash flow can also produce a zero terminal value, the value in D9 alone doesn’t identify the cause.
Check the zero-share safeguard
Reset the baseline, then change G17 to 0.
The supplied execution record produced:
B14 Equity value = 1,991.62
B15 Implied value per share = 0
The IF condition prevents a division-by-zero error, but zero shares isn’t a meaningful assumption for a per-share valuation. A blank share count is also treated as zero by this formula. Negative shares can produce a misleading per-share result, while text generally produces a formula error. Correct all such inputs.
Check input completeness
Review G2:G17 before accepting the outputs. The displayed formulas don’t contain ISNUMBER, blank-input, or model-status controls.
Specific risks include:
- Blank growth or margin assumptions being treated as zero.
- Blank cash or debt being treated as zero in the equity calculation.
- A blank diluted share count causing
B15to return zero. - Text inputs causing formula errors rather than a controlled validation message.
This is a manual input-quality check for the supplied template. If you add data validation to a working copy, continue to inspect pasted and imported values separately.
Review the assumptions, not only the formulas
A mechanically consistent DCF can still produce an unsuitable valuation if its assumptions aren’t defensible. Review:
- Revenue growth against market size, capacity, customer retention, and pricing assumptions.
- EBITDA margin against the expense forecast and operating constraints.
- D&A and capital expenditure against the asset base and investment plan.
- Working capital against receivable, inventory, and payable behavior.
- Cash taxes against expected taxable income and available tax attributes.
- WACC against the business and financing risks being modeled.
- Perpetual growth against a sustainable mature-state outlook.
- Cash, debt, debt-like obligations, and diluted shares as of a consistent date.
Three years is suitable for this compact example, but it isn’t sufficient for every company. Extend the explicit forecast if the company won’t reach a defensible long-term operating state within the initial period.
Review the DCF with ModelMonkey
ModelMonkey is an AI assistant for spreadsheet work in Google Sheets and Microsoft Excel. Using workbook context, it can help read ranges, inspect formulas and formula errors, analyze data, and make spreadsheet changes.
For this workbook, you could use this request:
Inspect
DCF Model!G2:G17andDCF Model!B2:D15. Explain the bridge from enterprise value inB12to implied value per share inB15, identify formula errors, and compare the baseline with a 12% WACC inG13. Don’t change any other assumptions.
You can also ask it to explain a formula in B2:D10 or update selected assumptions. When the workflow presents a preview, review the proposed edits before proceeding. The analyst remains responsible for validating the inputs, formulas, and valuation conclusion.
To reproduce the example, copy the Google Sheets template or download the Excel file. Enter the baseline assumptions and confirm that B12, B14, and B15 return 2,171.62, 1,991.62, and 39.83.