
Enterprise value = Σ [FCFFₜ ÷ (1 + WACC)ᵗ] + [terminal value ÷ (1 + WACC)ⁿ]
Using the Gordon growth method:
Terminal value = FCFFₙ × (1 + g) ÷ (WACC - g)
Here, t is the forecast period, n is the final forecast year, and g is the perpetual terminal growth rate. WACC must exceed g.
Because an FCFF-based DCF calculates enterprise value, you must convert the result to equity value before calculating value per share:
Equity value = Enterprise value + cash - debt ± other material adjustments
Intrinsic value per share = Equity value ÷ diluted shares
In the illustrative five-year example below, these formulas produce an enterprise value of 1,856.06, an equity value of 1,756.06, and an intrinsic value of 35.12 per diluted share. The example uses USD millions except for per-share amounts and assumes end-of-period discounting.
A DCF calculates value from its inputs, but it doesn’t determine whether the forecast, WACC, or terminal-growth assumption is economically appropriate. NYU Stern’s discounted cash flow materials explain the broader valuation framework.
The five-year DCF result
The calculation is:
PV of Years 1-5 FCFF =   485.60
PV of terminal value = 1,370.46
Enterprise value     = 1,856.06

Enterprise value     = 1,856.06
Cash                 =   200.00
Debt                 =  (300.00)
Equity value         = 1,756.06

Value per share      = 1,756.06 ÷ 50 = 35.12
| Calculation | Result |
|---|---|
| Present value of Years 1-5 FCFF | 485.60 |
| Terminal value at the end of Year 5 | 2,207.14 |
| Present value of terminal value | 1,370.46 |
| Enterprise value | 1,856.06 |
| Equity value | 1,756.06 |
| Intrinsic value per share | 35.12 |
| Price after a 15% margin of safety | 29.85 |
| Terminal value as a share of enterprise value | 73.84% |
Copy the five-year DCF workbook
The synthetic 5-Year Discounted Cash Flow Valuation Formula Template is available in two formats:
The workbook uses the DCF Analysis sheet. Replace the inputs in G1, B5:B12, and B20:C24, but don’t overwrite formula cells B13, D20:F24, or G5:G14.
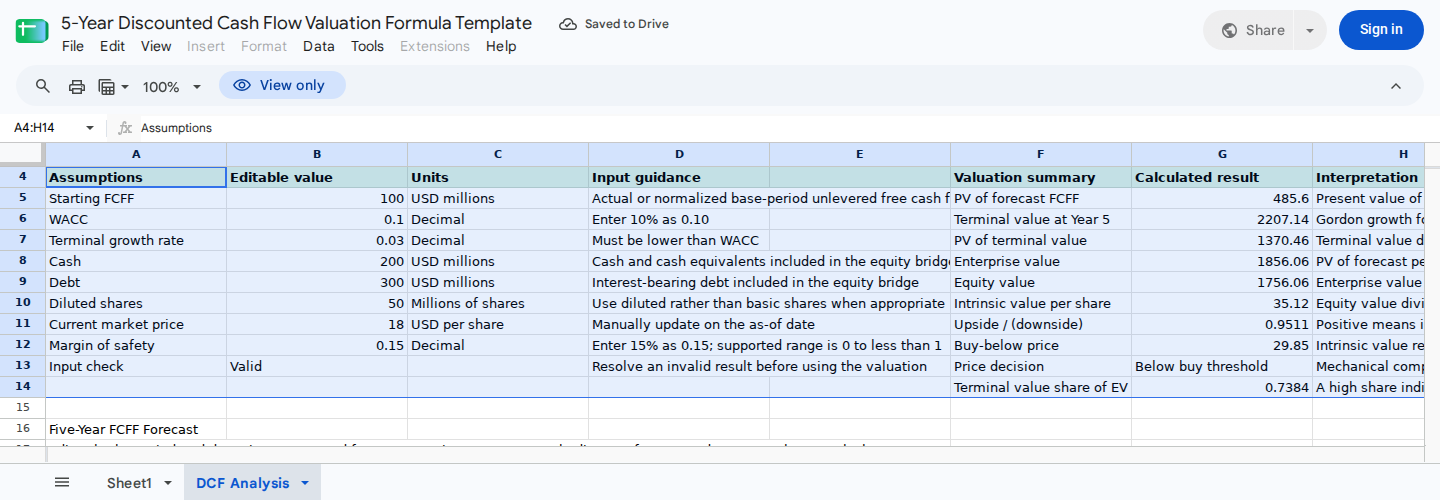
Enter valuation assumptions on the left and read the corresponding valuation summary on the right.
Enter the DCF assumptions
Start with these illustrative inputs:
| Cell | Input | Value | Units |
|---|---|---|---|
| G1 | Valuation date | 2026-11-10 | Date |
| B5 | Starting normalized FCFF | 100 | USD millions |
| B6 | WACC | 0.10 | Decimal |
| B7 | Terminal growth rate | 0.03 | Decimal |
| B8 | Cash | 200 | USD millions |
| B9 | Debt | 300 | USD millions |
| B10 | Diluted shares | 50 | Millions of shares |
| B11 | Illustrative market price | 18 | USD per share |
| B12 | Margin of safety | 0.15 | Decimal |
Enter rates as decimals: use 0.10 for 10%, not 10. Keep FCFF, cash, and debt in the same currency and scale.
For a company-specific valuation, reconcile cash, debt, diluted shares, and other bridge items to the relevant filing. You can find company filings through the SEC’s EDGAR company search.
Enter the five-year FCFF forecast
Next, enter these dates and unlevered FCFF forecasts in B20:C24:
| Row | Period | Date in column B | FCFF in column C |
|---|---|---|---|
| 20 | Year 1 | 2027-11-10 | 110 |
| 21 | Year 2 | 2028-11-10 | 120 |
| 22 | Year 3 | 2029-11-10 | 130 |
| 23 | Year 4 | 2030-11-10 | 140 |
| 24 | Year 5 | 2031-11-10 | 150 |
In this model, the dates are labels. The formulas discount cash flows by integer periods 1 through 5, not by the exact number of days from the valuation date.
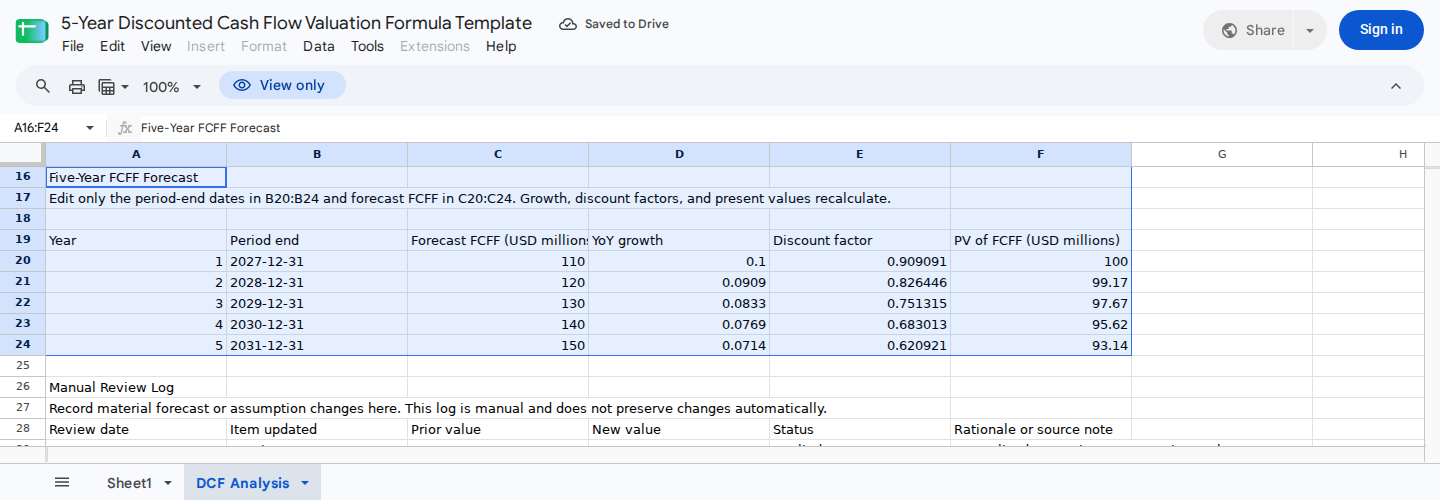
The forecast schedule shows how each annual FCFF is discounted before it enters the valuation summary.
Discount each forecast-period FCFF
For each forecast year:
Discount factorₜ = 1 ÷ (1 + WACC)ᵗ
Present value of FCFFₜ = FCFFₜ × discount factorₜ
The copied workbook already contains these formulas. If you want to reproduce the schedule separately, enter this Year 1 growth formula in D20:
=IF($B$5=0,"",C20/$B$5-1)
Then enter the following formula in D21 and fill it through D24:
=IF(C20=0,"",C21/C20-1)
Enter the discount factor in E20 and fill it through E24:
=ROUND(1/(1+$B$6)^ROWS($E$20:E20),6)
Finally, enter the present-value formula in F20 and fill it through F24:
=C20*E20
The completed schedule produces:
| Year | FCFF | Discount factor | Present value |
|---|---|---|---|
| 1 | 110 | 0.909091 | 100.00 |
| 2 | 120 | 0.826446 | 99.17 |
| 3 | 130 | 0.751315 | 97.67 |
| 4 | 140 | 0.683013 | 95.62 |
| 5 | 150 | 0.620921 | 93.14 |
| Total | 485.60 |
Cell G5 calculates the control total:
=ROUND(SUM(F20:F24),2)
With six-decimal discount factors, the unrounded total is approximately 485.60445, which rounds to 485.60.
Microsoft’s formula documentation explains the relative and absolute references used here. Some spreadsheet locales require semicolons instead of commas between function arguments.
Calculate and discount terminal value
Terminal value represents cash flows after the explicit five-year forecast:
Terminal value at Year 5
= 150 × (1 + 3%) ÷ (10% - 3%)
= 2,207.14
The workbook calculates terminal value in G6:
=IF($B$13<>"Valid",0,ROUND(C24*(1+$B$7)/($B$6-$B$7),2))
Because terminal value is measured at the end of Year 5, you must discount it for five periods:
PV of terminal value
= 2,207.14 × 0.620921
= 1,370.46
The formula in G7 is:
=IF($B$13<>"Valid",0,ROUND(G6*E24,2))
Using Year 5 FCFF while discounting terminal value for only four periods would overstate its present value. The cash-flow base and discount period must refer to the same point in time.
Calculate enterprise value and equity value
Cell G8 adds the present values of the forecast-period FCFF and terminal value:
=IF($B$13<>"Valid",0,G5+G7)
Enterprise value = 485.60 + 1,370.46 = 1,856.06
The next step is the enterprise-to-equity bridge. Cell G9 calculates the simplified bridge:
=IF($B$13<>"Valid",0,MAX(0,G8+$B$8-$B$9))
Equity value = 1,856.06 + 200 - 300 = 1,756.06
The MAX(0,...) floor is a workbook convention. If the unfloored equity value is negative, inspect that amount separately instead of treating the displayed zero as an economic conclusion.
For a company-specific valuation, the bridge may also require adjustments for nonoperating investments, lease liabilities, preferred stock, noncontrolling interests, or other material claims.
Calculate intrinsic value per share
Cell G10 divides equity value by diluted shares:
=IF($B$13<>"Valid",0,ROUND(G9/$B$10,2))
Intrinsic value per share = 1,756.06 ÷ 50 = 35.12
To compare that result with the synthetic market-price input in B11, cell G11 uses:
=IF($B$13<>"Valid",0,G10/$B$11-1)
At a price of 18, G11 returns 95.11%. This is an illustrative comparison, not a current quote or investment recommendation.
The 15% margin-of-safety calculation in G12 is:
=IF($B$13<>"Valid",0,G10*(1-$B$12))
35.12 × (1 - 15%) = 29.852
Although the cell displays 29.85, the underlying value remains 29.852. Cell G13 compares the market price with that unrounded value:
=IF($B$13<>"Valid","Fix assumptions",IF($B$11<$G$12,"Below buy threshold",IF($B$11>$G$10,"Above intrinsic value","Between buy threshold and intrinsic value")))
That hidden precision matters at the boundary. A market-price input of 29.85 is classified as Below buy threshold because 29.85 < 29.852, even though both cells display 29.85.
If you want a separate model to classify values using displayed cents, round G12 explicitly:
=IF($B$13<>"Valid",0,ROUND(G10*(1-$B$12),2))
When B11 remains a positive number and B12 remains valid, changing only the market price doesn’t affect the calculated intrinsic value. For example, changing B11 from 18 to 40 leaves G10 at 35.12 while changing G13 from Below buy threshold to Above intrinsic value.
The supplied workbook includes these comparison inputs in its validation gate. A blank, zero, or text market price, or an invalid margin of safety, makes B13 invalid and causes G6:G10 to return zero. Those zeros indicate an invalid-input state, not a zero valuation.
Build a WACC and terminal-growth sensitivity table
Cell G14 calculates terminal value as a share of enterprise value:
=IF($B$13<>"Valid",0,IF(G8=0,0,G7/G8))
The baseline result is:
1,370.46 ÷ 1,856.06 = 73.84%
Terminal value accounts for most of this example’s enterprise value. It’s therefore important to review value per share across several WACC and terminal-growth combinations.
Create a sheet named Sensitivity, then enter:
- WACC assumptions of
9%,10%, and11%inB2:D2. - Terminal-growth assumptions of
2%,3%, and4%inA3:A5. - The formula below in
B3, filled acrossB3:D5.
=IF(OR(COUNT(B$2,$A3,'DCF Analysis'!$B$8:$B$10,'DCF Analysis'!$C$20:$C$24)<>10,B$2<=0,$A3<=-1,B$2<=$A3,'DCF Analysis'!$B$8<0,'DCF Analysis'!$B$9<0,'DCF Analysis'!$B$10<=0),NA(),ROUND(MAX(0,SUMPRODUCT('DCF Analysis'!$C$20:$C$24,1/(1+B$2)^ROW($A$1:$A$5))+('DCF Analysis'!$C$24*(1+$A3)/(B$2-$A3))/(1+B$2)^5+'DCF Analysis'!$B$8-'DCF Analysis'!$B$9)/'DCF Analysis'!$B$10,2))
This formula requires numeric scenario rates, cash, debt, diluted shares, and five FCFF values. It also requires:
- Positive WACC and diluted shares.
- Terminal growth greater than
-100%and below WACC. - Nonnegative cash and debt under this example’s convention.
The formula applies the same zero-equity-value floor used in G9 and returns #N/A when a required condition fails.
Holding FCFF, cash, debt, and diluted shares constant produces this value-per-share sensitivity table:
| Terminal growth | 9% WACC | 10% WACC | 11% WACC |
|---|---|---|---|
| 2% | 36.39 | 31.46 | 27.63 |
| 3% | 41.45 | 35.12 | 30.38 |
| 4% | 48.54 | 40.00 | 33.91 |
The central 10% WACC and 3% terminal-growth case reconciles to the baseline value of 35.12 per share. Lower WACC or higher terminal growth raises calculated value, while higher WACC or lower growth reduces it. These are scenario calculations, not forecasts.
For more on assumption design, see Building a DCF Model.
Check the inputs and reconciliation
The supplied workbook’s B13 formula checks WACC, terminal growth, diluted shares, market price, and margin of safety:
=IF(AND(COUNT(B6:B7)=2,COUNT(B10:B12)=3,B6>0,B6>B7,B10>0,B11>0,B12>=0,B12<1),"Valid","Invalid: check WACC, terminal growth, shares, price, and margin of safety")
However, this check is incomplete. It doesn’t confirm that:
- Terminal growth is greater than
-100%. - Starting FCFF, cash, debt, and all five forecast FCFF values are numeric.
- Cash and debt follow the model’s nonnegative input convention.
A blank input outside the check may be treated as zero, while text can cause formula errors. As a result, you shouldn’t treat B13 = Valid as proof that the valuation inputs are complete.
To reproduce or strengthen the model, use a comprehensive check:
=IF(AND(COUNT(B5:B12)=8,COUNT(C20:C24)=5,B6>0,B7>-1,B6>B7,B8>=0,B9>=0,B10>0,B11>0,B12>=0,B12<1),"Valid","Invalid: check FCFF, WACC, terminal growth, cash, debt, shares, price, and margin of safety")
This version permits negative FCFF, which may be a valid forecast input, while enforcing the required numeric checks and terminal-growth boundary.
Before interpreting the result, confirm that:
B13displaysValid.- Terminal growth is greater than
-1and below WACC. B5,B8:B9, andC20:C24contain the intended numeric values.- FCFF, cash, and debt use the same currency and scale.
- The forecast uses unlevered FCFF consistently.
- Diluted shares are greater than zero.
- Discount exponents run from 1 through 5.
- Terminal value uses Year 5 FCFF and is discounted five periods.
G5 + G7 = G8.MAX(0,G8 + B8 - B9) = G9.ROUND(G9 / B10,2) = G10.- Every sensitivity case keeps WACC above terminal growth.
The recorded baseline returned B13 = Valid, enterprise value of 1,856.06, equity value of 1,756.06, and intrinsic value per share of 35.12. In a separate recorded case, setting diluted shares to zero made B13 invalid and changed G13 to Fix assumptions, preventing a usable per-share result.
Refresh the DCF at the next review
At each quarterly or annual review:
- Update the valuation date in
G1. - Replace the assumptions in
B5:B12. - Replace all five forecast dates and FCFF values in
B20:C24. - Confirm that
B13returnsValid, then complete the checks above. - Recheck the equity bridge, value per share, terminal-value share, and sensitivity table.
- Record material changes in the next empty row of
A29:F40, including the review date, changed item, prior value, new value, status, and rationale.
The template doesn’t automatically shift forecast years or retain previous versions. Its supported forecast horizon is fixed at Years 1-5. Extending the schedule beyond row 24 requires changes to the forecast sum, terminal-value base, and terminal-value discount formula.
Check the DCF with ModelMonkey
ModelMonkey can inspect workbook context and help read ranges, identify formula errors, analyze spreadsheet content, or propose formula and cell changes in Google Sheets and Excel. It can help check the workbook, but it can’t determine whether the forecast, WACC, terminal-growth rate, or equity-bridge treatment is economically appropriate.
After copying the workbook, use this task-specific request:
Check
DCF Analysis!B5:B13,DCF Analysis!C20:F24, andDCF Analysis!G5:G14. Confirm that required arithmetic inputs are numeric, terminal growth is greater than -1, WACC exceeds terminal growth, discount periods run from 1 through 5, terminal value uses Year 5 FCFF and is discounted five periods, and the enterprise-to-equity bridge reconciles. Report formula errors or invalid inputs before proposing changes.
When the workflow presents a preview, review the proposed spreadsheet changes before proceeding.