
As a subscription benchmark, Google Business Starter’s standard USD price was $7 per user per month with a one-year commitment, billed monthly and excluding tax, when checked on October 13, 2026. Promotional pricing and individual contracts may differ. At that rate, 20 seats cost $140 per month before tax. That $140 is a Workspace subscription cost, not an Apps Script execution charge. Google Workspace pricing.
The calculator below separates subscription costs from usage charges. Unknown inputs remain incomplete, and the workload calculations were checked in Google Sheets. All results are forecasts, not records of cash paid.
Which charges belong in the budget?
| Item | Pricing treatment | Decision to make |
|---|---|---|
| Ordinary custom Apps Script app within Workspace | No separate Workspace app-use license charge | Confirm that the workflow uses the included services you expect |
| Workspace subscription | Seats multiplied by your plan's applicable rate | Check whether the team needs new seats or already has suitable licenses |
| Google Cloud resources or metered APIs | Service-specific tariff and usage | Identify enabled resources and the actual billed unit |
| External provider | That provider's subscription and usage terms | Check base charges, allowances, minimums and billable events |
| Tax and currency conversion | Depends on the billing arrangement | Add supported estimates before comparing an all-in budget |
Costs and quotas need separate checks. Paying for a Workspace subscription doesn’t remove every service limit, and a quota warning isn’t a dollar price. Review the current Apps Script quotas for the account that runs the script, along with each service’s pricing.
Use the Google Sheets cost calculator
Copy the Google Sheets planner, then open Cost calculator!A1:D21. You can also download the separate cost calculator workbook if you want only this tab. The native copy includes the recipient planning and audit tabs.
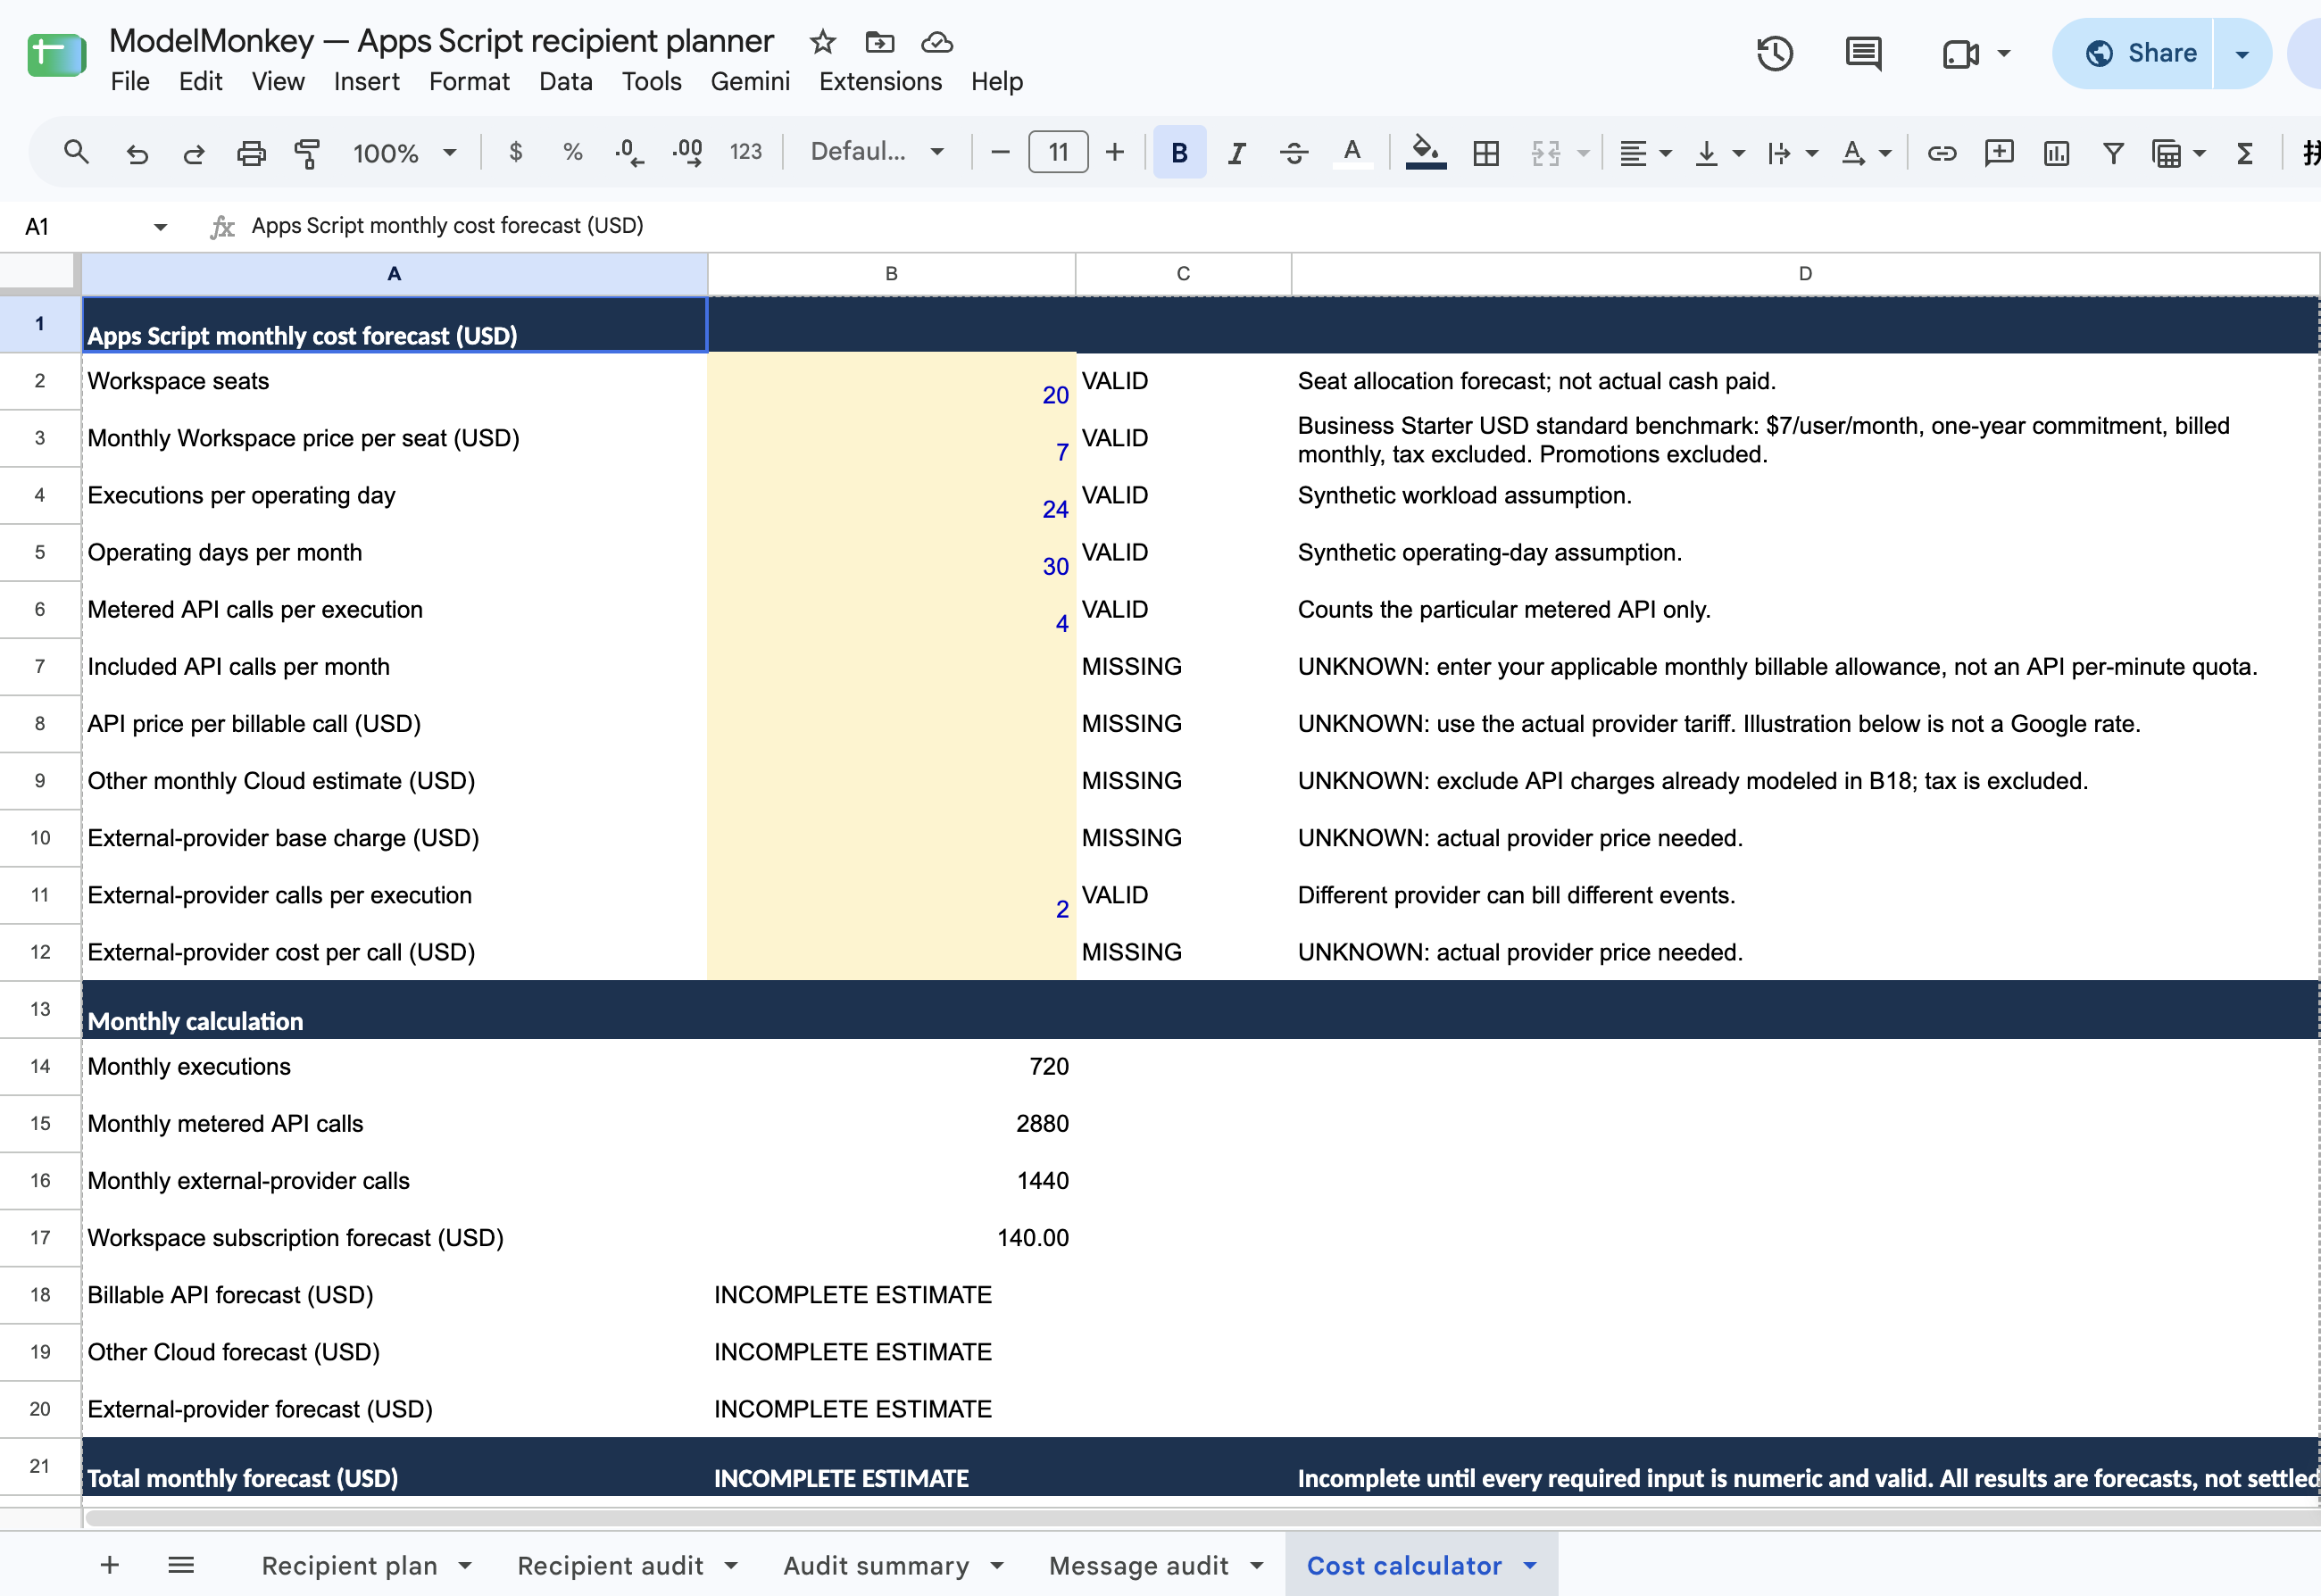
| Input | Restored value | Meaning |
|---|---|---|
B2, Workspace seats | 20 | Subscription allocation, not a payment record |
B3, monthly price per seat | $7 | Business Starter USD benchmark, one-year commitment, tax excluded |
B4, executions per operating day | 24 | Synthetic workload assumption |
B5, operating days per month | 30 | Synthetic workload assumption |
B6, metered API calls per execution | 4 | Events billed by the particular API |
B7, included monthly API calls | Blank | Unknown until the applicable allowance is established |
B8, price per billable API call | Blank | Unknown until the provider tariff is established |
B9, other monthly Cloud estimate | Blank | Exclude API charges already counted in B18 |
B10, external-provider base charge | Blank | Unknown provider subscription price |
B11, external calls per execution | 2 | Separate count for a different provider |
B12, external cost per call | Blank | Unknown provider usage price |
With the restored values, the calculator gives B14=720 monthly executions, B15=2880 metered API calls, B16=1440 external calls, and B17=140 for the subscription forecast. Because prices and allowances are still missing, B21 returns INCOMPLETE ESTIMATE instead of turning them into zero-dollar charges.
Statuses in C2:C12 check the type and sign of each input. Counts must be whole, nonnegative numbers, while prices must be nonnegative numbers. Malformed inputs return INVALID INPUT; missing inputs return INCOMPLETE ESTIMATE. Enter zero only when a charge or allowance is known to be zero.
For the workload calculation, monthly executions equal executions per day multiplied by operating days. Each provider’s call total then uses the corresponding calls per execution. Billable API calls are the amount above the monthly allowance. Finally, the calculator combines the subscription, API, other Cloud, and external-provider forecasts once.
Reproduce the recorded calculation
Set B7=1000, B8=0.01, B9=5, B10=10, and B12=0.02. These are illustrative inputs, not actual Google or external-provider tariffs. In the recorded Google Sheets test:
B18returned $18.80 for 1,880 billable API calls.B20returned $38.80 for the provider base charge plus 1,440 calls.B21returned $202.60 for the complete monthly forecast.
Next, set B7=2880. The API estimate becomes zero at the exact allowance. With B7=2879, it becomes $0.01. Clear the five illustrative price and allowance inputs afterward to restore the incomplete baseline.
The calculator was tested with 63 native cases covering missing inputs, text, numeric text, whitespace, negative values, fractional counts, known zeros, boundaries, and restoration. The separate XLSX uses the same 19 tested formulas and baseline inputs. Its cached results and formula errors were checked, but the workbook wasn’t executed in the Microsoft Excel interface.
This calculator assumes linear monthly pricing. Pricing tiers, minimum charges, retries, tax, and currency conversion require additional modeling when applicable. Also, a monthly billable allowance isn’t the same as an API’s per-minute request quota.
Compare two monthly workflows
Spreadsheet data writes: $140 subscription forecast
The dirty import below used 47 clean-data write requests. Repeating that workload over 20 operating days produces a forecast of 940 monthly data writes. The count excludes headers, setup, verification reads, and other lifecycle calls, and it doesn’t represent 940 measured Apps Script executions.
To reproduce the tested scenario, set B2=20, B3=7, B4=47, B5=20, B6=1, and the other inputs to zero. B21 returns $140 before tax, all from the subscription allocation.
Google’s Sheets API page states that standard use currently has no additional cost and describes above-quota billing as planned for later in 2026. Because that notice is date-sensitive, check it again before preparing a budget. Sheets API request quotas are per-minute limits, not a monthly allowance of free calls. Sheets API limits.
If the seats are already licensed, this allocation isn’t a new subscription purchase. The scenario assumes that additional services and other charges are zero; it doesn’t establish that from an invoice.
Image text detection: $142.82 forecast
Google Vision’s Text Detection tariff includes the first 1,000 feature units per month at no charge. Units from 1,001 through 5 million cost $1.50 per 1,000, with the final block prorated. Applying one feature to one image counts as one unit. Other Cloud resources may add charges. Google Vision pricing.
For 24 planned executions per day over 30 days, with each execution requesting Text Detection on four images, the forecast is 2,880 units. Enter B4=24, B5=30, B6=4, B7=1000, and B8=0.0015. Keep B2=20, B3=7, and the other charge inputs at zero. The calculator returned $2.82 in B18 and $142.82 in B21 before tax.
This scenario assumes exactly one image and one Text Detection feature per request. Only the spreadsheet arithmetic was tested; the Vision API and OCR accuracy weren’t. Other charges are assumed to be zero, and no cash payment was measured.
Check a dirty 50,000-row import before estimating calls
Download the dirty CSV, Download the Python normalizer, Download the clean output, and Download the rejection log.
python3 pricing-import-normalize.py pricing-import-dirty-50000.csv clean.csv rejects.csv
The dirty CSV has six fields: ID, Amount, Date, DateFormat, Currency, and Note. The clean output has five: ID, AmountCents, DateISO, Currency, and Note. Only the exact value USD is accepted for Currency, and Note is optional.
Each source date is declared as ISO, DDMM day-first, or Excel’s 1900 date system, so the normalizer doesn’t guess ambiguous dates. It rejects Excel serial 60, the fictitious February 29, 1900, along with fractional and out-of-range serials.
The recorded run produced 46,550 clean rows and 3,450 rejects. These included 500 each for missing IDs, invalid amounts, blank dates, malformed dates, and invalid serials, plus 950 repeated valid IDs. The first valid occurrence of each ID is retained. In addition, the clean output preserves 6,650 rows with a blank optional Note. Amounts use decimal arithmetic and integer cents.
All 46,550 clean records were imported into Pricing clean import in this copyable Google Sheet. The import used 47 data writes of up to 1,000 rows, one header write, one controls write, and two structural requests. By comparison, a hypothetical 500-row clean-data batch would require 94 data writes before setup and headers.
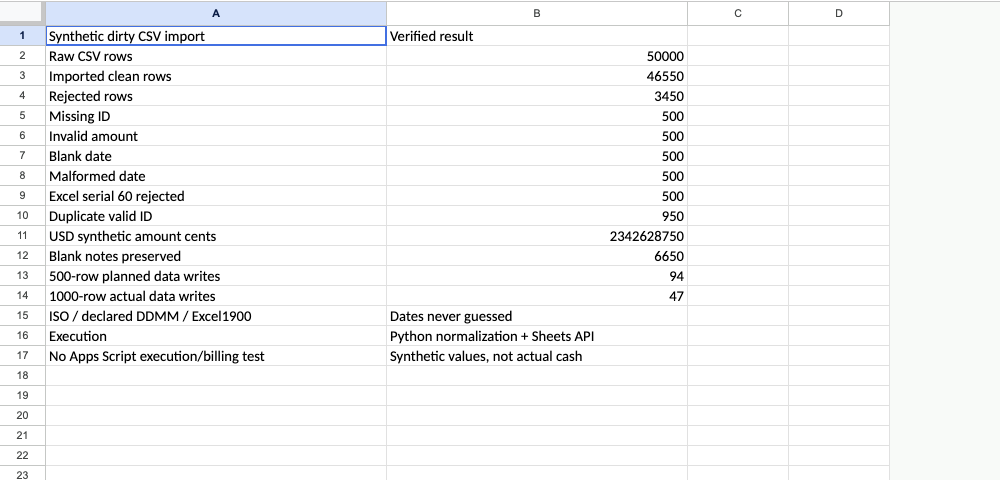
During full readback, all five fields and the order of every imported record matched independent expectations. The synthetic total was 2,342,628,750 cents. All ten pre-existing tabs retained their formula and value hashes.
This test covered Python normalization and a Sheets API import. It didn’t test an Apps Script run, runtime suitability, production throughput, or billing. The transactions are synthetic, not cash received. Enter the workflow’s actual billable events in the calculator because row count alone doesn’t determine the price.
Email quotas remain a separate constraint
The native workbook also has a 10,000-row recipient audit download. Its restored Audit summary shows 9,800 basic-pass recipient occurrences, 4,900 distinct identities, and 200 review rows. Repeated addresses in different messages remain separate delivery occurrences.
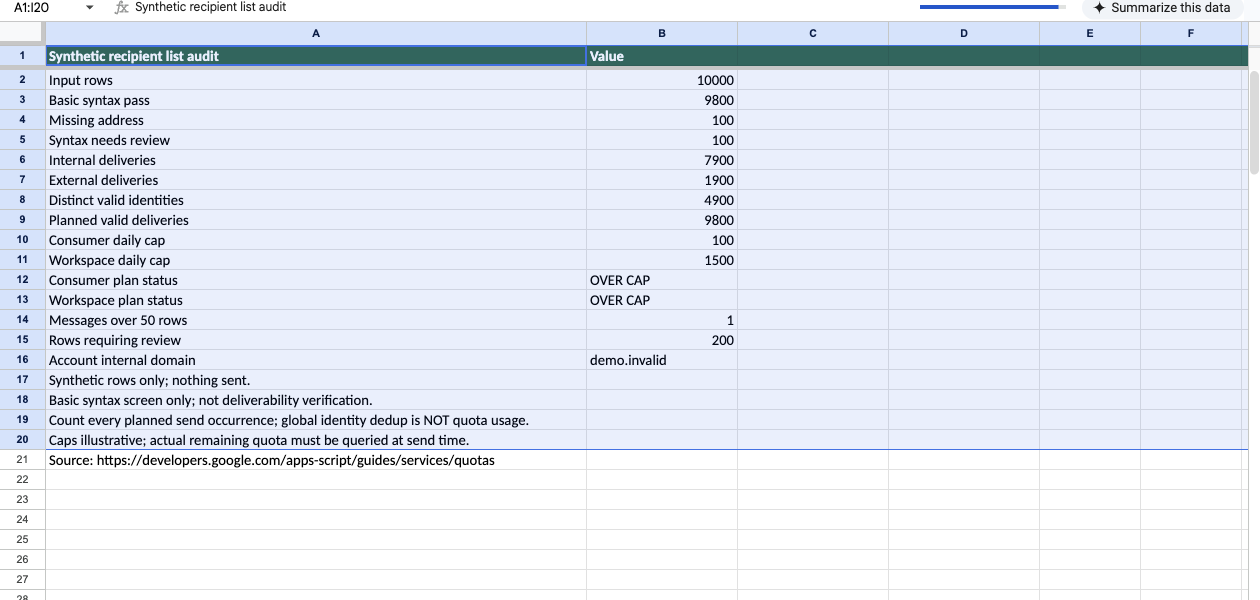
The fixture sent no email and didn’t query a live quota. Its editable cap scenarios compare workloads; they don’t represent purchased sending capacity or a provider invoice. MailApp.getRemainingDailyQuota() reports the remaining recipient quota when called, but it doesn’t increase or reserve that quota. See the dedicated email recipient quota guide for the audit walkthrough.