
Build a Facebook Ads Report in Google Sheets
Copy a Facebook Ads template, add campaign data, and track ROAS, CPA, budget, owners, and weekly actions in Google Sheets.
This Facebook Ads report template brings campaign spending, attributed revenue, results, budgets, and weekly decisions together in Google Sheets. Because it uses separate ROAS and CPA rules, an FP&A or marketing finance analyst can evaluate sales and lead-generation campaigns with the appropriate measures.
Copy this Google Sheets template or download the Excel file. The synthetic example is titled Facebook Ads Weekly Performance and Decision Report, Google Sheets Template.
You’ll need to enter data manually or paste exported records. The template doesn’t synchronize with Facebook Ads.
What You'll Need
- Access to Google Sheets
- Campaign budgets and a ROAS or CPA target
- Daily campaign and ad-set performance data
- One consistent revenue-attribution basis
- A copy of the Google Sheets template or downloaded Excel file
Step-by-Step Guide
Review the report structure
The workbook contains one sheet named Ads Report:
A2:L2: reporting dates, targets, and configured budgetA4:P5: calculated blended KPIs and overall signalA9:T16: campaign summaries, decision rules, owners, and actionsA19:O36: daily campaign and ad-set records
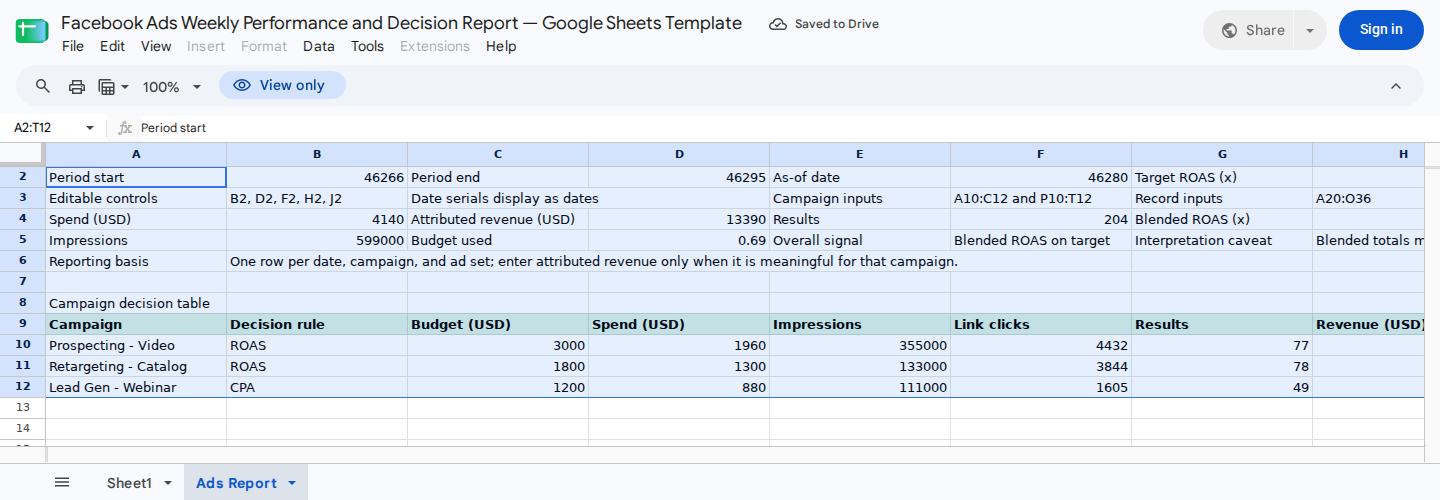
Set the period and targets at the top. Then use the campaign table to assign each calculated performance result an owner, next action, and review date.
Don’t paste over B4:P5 or D10:O12. These ranges contain formulas, labels, or interpretation notes.
Two displayed labels should match the underlying calculations:
- Rename
M4from Link clicks to Clicks andO4from Link CTR to CTR. - Rename
F9from Link clicks to Clicks andI9from Link CTR to CTR.
The calculated click fields use record-log column K. Although column L stores link clicks, it isn’t used in those summary calculations.
Also rename K2 from Active budget to Configured budget. Cell L2 sums campaign budgets regardless of delivery state, so enter zero for any inactive campaign that should be excluded.
Set the dates, targets, and formula guards
Start by entering these example controls:
| Cell | Meaning | Value |
|---|---|---|
B2 | Period start | September 1, 2026 |
D2 | Period end | September 30, 2026 |
F2 | Data as-of date | September 15, 2026 |
H2 | Target ROAS | 2.5x |
J2 | Target cost per result | $45 |
Format B2, D2, and F2 as dates, H2 as a number or 0.00x, and J2 as USD. If a date appears as a serial such as 46266, apply a date format instead of changing its value.
Cells B2 and D2 determine which records are included. By contrast, F2 indicates how current the data is but doesn’t filter the calculations.
Use this guarded overall-signal formula in F5:
=LET(
  dates_ok,IFERROR(AND(ISNUMBER($B$2),ISNUMBER($D$2),$B$2<=$D$2),FALSE),
  target_ok,IFERROR(AND(ISNUMBER($H$2),$H$2>0),FALSE),
  IF(
    NOT(dates_ok),"Check dates",
    IF(
      NOT(target_ok),"Check target",
      IF(
        B4=0,"No spend",
        IF(H4>=$H$2,"Blended ROAS on target","Blended ROAS below target")
      )
    )
  )
)
This formula prevents a blank, text, or reversed reporting period from being treated as a valid period with no spending. To check its behavior, temporarily test:
- Blank
B2: expectCheck dates. - Text in
D2: expectCheck dates. - A start date later than the end date: expect
Check dates. - Valid dates with
H2set to zero: expectCheck target.
These guard cases are formula acceptance checks. They weren’t part of the supplied native execution record.
Configure campaigns and decision rules
Next, enter the example campaign setup in A10:C12:
| Campaign | Rule | Budget |
|---|---|---|
| Prospecting - Video | ROAS | $3,000 |
| Retargeting - Catalog | ROAS | $1,800 |
| Lead Gen - Webinar | CPA | $1,200 |
Campaign names must match record-log column B. Google Sheets SUMIFS text matching is generally case-insensitive, but extra spaces, punctuation changes, or different wording can prevent a record from matching. See Google’s SUMIFS documentation.
Use only ROAS or CPA in B10:B12:
ROAScompares campaign ROAS withH2; higher is better.CPAcompares cost per result withJ2; lower is better.- An unsupported or space-padded rule returns
Check rule.
Place this formula in O10, then fill it down through O12:
=LET(
  decision_rule,B10,
  campaign_budget,C10,
  campaign_spend,D10,
  campaign_results,G10,
  campaign_cpa,K10,
  campaign_roas,L10,
  dates_ok,IFERROR(
    AND(ISNUMBER($B$2),ISNUMBER($D$2),$B$2<=$D$2),
    FALSE
  ),
  rule_ok,OR(decision_rule="ROAS",decision_rule="CPA"),
  target_ok,IF(
    decision_rule="ROAS",
    IFERROR(AND(ISNUMBER($H$2),$H$2>0),FALSE),
    IF(
      decision_rule="CPA",
      IFERROR(AND(ISNUMBER($J$2),$J$2>0),FALSE),
      FALSE
    )
  ),
  data_ok,IFERROR(
    AND(
      ISNUMBER(campaign_budget),campaign_budget>=0,
      ISNUMBER(campaign_spend),campaign_spend>=0,
      ISNUMBER(campaign_results),campaign_results>=0,
      ISNUMBER(campaign_cpa),campaign_cpa>=0,
      ISNUMBER(campaign_roas),campaign_roas>=0
    ),
    FALSE
  ),
  IF(
    NOT(dates_ok),"Check dates",
    IF(
      NOT(rule_ok),"Check rule",
      IF(
        NOT(target_ok),"Check target",
        IF(
          NOT(data_ok),"Check data",
          IF(
            campaign_spend=0,"No spend",
            IF(
              decision_rule="ROAS",
              IF(campaign_roas>=$H$2,"On target","Below target"),
              IF(
                campaign_results=0,"Insufficient results",
                IF(campaign_cpa<=$J$2,"On target","Above target")
              )
            )
          )
        )
      )
    )
  )
)
With this formula, a positive-spend CPA campaign with zero results can’t pass simply because its displayed cost per result is zero. The replacement formula’s additional guard behavior wasn’t separately covered by the supplied execution record.
Finally, complete the manual fields in P10:T12:
- Owner
- Next action
- Next-review date
- Audience
- Decision note
Format R10:R12 as dates. These management fields aren’t generated from the record log.
Replace the sample record data
Delete or overwrite only the sample inputs in A20:O34. Then enter one aggregate row per date, campaign, and ad set in A20:O36.
| Column | Field |
|---|---|
A | Date |
B | Campaign |
C | Ad set |
D | Objective |
E | Result unit |
F | Delivery state |
G | Audience |
H | Creative |
I | Spend |
J | Impressions |
K | Clicks used for calculated CTR |
L | Link clicks retained in the log |
M | Results |
N | Attributed revenue |
O | Note or exception |
Apply these formats:
A20:A36as datesI20:I36andN20:N36as USDJ20:M36as whole numbers
You may retain a paused row with zero spending for audit history.
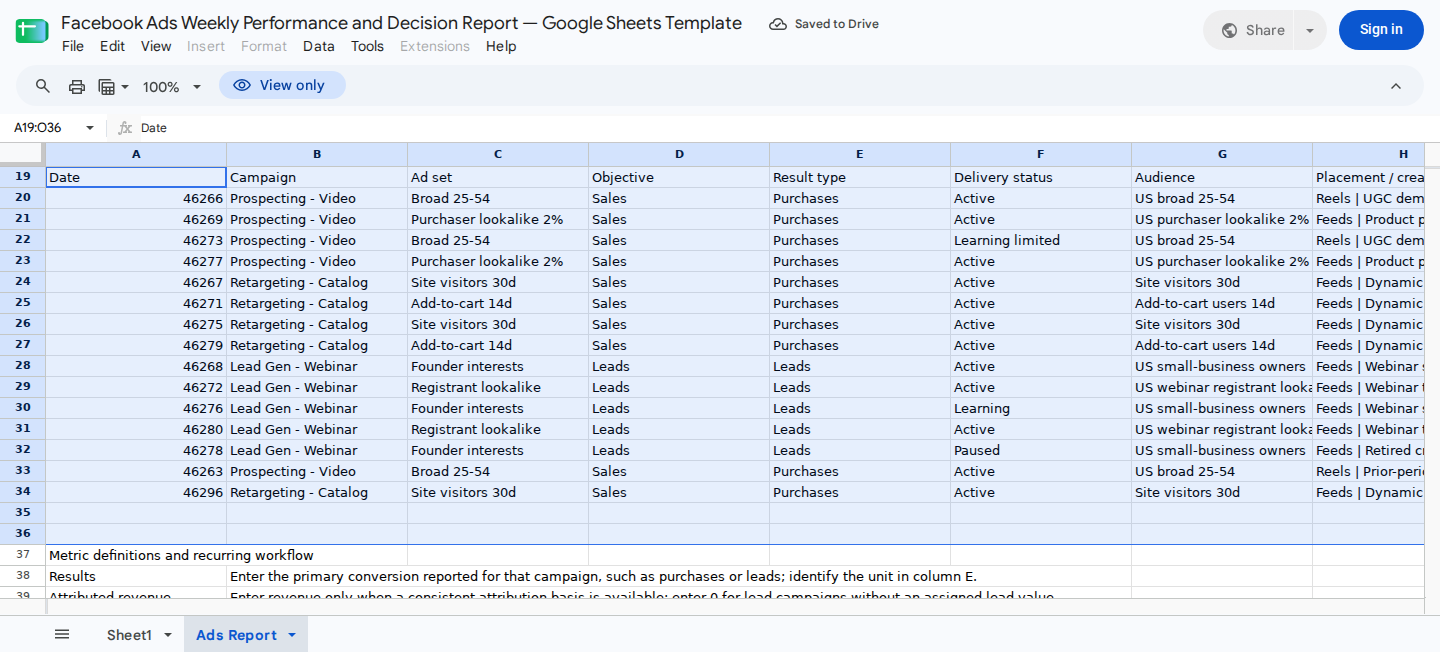
The source log records spend, delivery metrics, results, revenue, and exceptions. Date filters exclude the labeled prior- and next-period rows.
Use one attribution basis for every amount in column N. If a lead campaign doesn’t have an assigned monetary value, enter 0 and use the CPA decision rule. Here, zero means no value was assigned. It doesn’t establish that the leads have no business value.
Before pasting an export, standardize its campaign names. The Google Sheets data-cleaning guide covers a broader cleanup process.
Verify the baseline report
For September 1-30, 2026, the supplied native spreadsheet execution returned:
| KPI | Expected result |
|---|---|
| Configured budget | $6,000 |
| Spend | $4,140 |
| Attributed revenue | $13,390 |
| Results | 204 |
| Blended ROAS | 3.23x |
| Blended cost per result | $20.29 |
| Remaining budget | $1,860 |
| Clicks | 9,881 |
| CTR | 1.65% |
| Overall signal | Blended ROAS on target |
The control arithmetic is:
Spend:              1,960 + 1,300 + 880 = 4,140
Attributed revenue: 7,150 + 6,240 + 0 = 13,390
Results:            77 + 78 + 49 = 204
Blended ROAS:       13,390 / 4,140 = 3.23x
Cost per result:    4,140 / 204 = $20.29
Remaining budget:   6,000 - 4,140 = $1,860
CTR:                9,881 / 599,000 = 1.65%
The campaign rows should show:
| Campaign | Decision measure | Remaining budget | Decision |
|---|---|---|---|
| Prospecting - Video | 3.65x ROAS | $1,040 | On target |
| Retargeting - Catalog | 4.80x ROAS | $500 | On target |
| Lead Gen - Webinar | $17.96 per result | $320 | On target |
The 204 blended results combine purchases and leads. Therefore, treat the blended cost per result as informational. Base decisions on each campaign’s result unit and selected ROAS or CPA rule.
Update the report each week
Follow this process for each weekly update:
- Append the new records at the first empty row. In the supplied fixture, the first empty row is initially
A35:O35. - Change
F2to the latest data date. - Inspect the decisions in
O10:O12. - Update next actions in
Q10:Q12. - Update review dates in
R10:R12.
To reproduce the supplied append case, begin with the unchanged September fixture. Set F2 to September 16, 2026, select A35, and paste this tab-delimited row:
2026-09-16 Retargeting - Catalog Add-to-cart 14d Sales Purchases Active Add-to-cart users 14d Feeds | Dynamic catalog 200 20000 600 540 12 960 New daily row
The values should fill A35:O35. If they remain in one cell, use Data > Split text to columns and select Tab as the separator.
After the update, the recorded execution returned:
- $4,340 total spend
- $14,350 attributed revenue
- 216 results
- 3.31x blended ROAS
- $1,660 remaining budget
- 10,481 clicks
- 1.69% CTR
- $1,500 retargeting spend
- 90 retargeting results
On targetfor the retargeting campaign
You can also run an independent no-activity check. First, remove the appended row and reset the untouched baseline. Then enter:
| Cell | Test value |
|---|---|
B2 | January 1, 2026 |
D2 | January 31, 2026 |
F2 | January 31, 2026 |
C12 | $0 |
Keep H2 at 2.5, J2 at $45, C10 at $3,000, and C11 at $1,800.
In the supplied execution record, this test returned a $4,800 configured budget, zero performance metrics, No spend in O10:O12, and no division errors. Remaining budgets were $3,000, $1,800, and $0.
Afterward, restore the September dates and set C12 back to $1,200.
When starting a new period, change B2 and D2 while retaining the historical records. The supplied execution confirmed that labeled August and October exceptions were excluded from the September totals.
The formulas use inclusive >=B2 and <=D2 criteria. However, exact start- and end-date rows weren’t separately isolated in the recorded test.
Complete the report review
Before sharing the report, confirm:
B2,D2, andF2contain valid dates.- The start date isn’t later than the end date.
- Applicable ROAS and CPA targets are positive numbers.
- Campaign budgets and delivery metrics are nonnegative numbers.
- Campaign names have consistent spelling, spacing, and punctuation.
- Every decision rule is
ROASorCPA. - Attributed revenue follows one documented basis.
- Unvalued lead campaigns use zero revenue and a CPA rule.
- A positive-spend CPA campaign with zero results shows
Insufficient results. - Invalid dates and targets remain visible instead of producing
No spend. - No data has overwritten
B4:P5orD10:O12. - Records outside the selected period are excluded.
- A valid period with no matching records shows zero metrics and
No spend.
ModelMonkey can help read these ranges, analyze their contents, report formula errors, and organize spreadsheet data. It doesn’t provide a verified Facebook Ads synchronization, so check its output against the source export.
For example, use this task-specific request:
Review Ads Report!A2:T12 and Ads Report!A20:O36 without changing cells.
Report formula errors, invalid or reversed dates, nonpositive targets,
negative or nonnumeric budgets and delivery metrics, unsupported campaign
rules, and campaign names with inconsistent spacing or punctuation.
Flag any CPA campaign with positive spend and zero results. Summarize
decisions in O10:O12 and remaining budgets in M10:M12.
Wrapping Up
The completed report connects daily Facebook Ads records with campaign-specific ROAS or CPA signals, configured budgets, owners, actions, and review dates. Its supplied baseline reconciles $4,140 of spending, $13,390 of attributed revenue, and $1,860 of remaining budget.
The record log supports 17 rows in A20:O36, and it doesn’t expand automatically. Before exceeding row 36, copy the workbook and extend every formula range that ends at row 36.
Frequently Asked Questions
Does the template import data from Facebook Ads?
No. Enter or paste aggregate records into Ads Report!A20:O36. The template doesn’t automatically synchronize or refresh Facebook Ads data.
Can I add more campaign rows?
Yes. To add up to four campaign summaries:
- Enter campaign names, rules, and budgets in
A13:C16. - Enter management fields in
P13:T16. - Copy
D12:O12down into the added rows. - Change
L2to=SUM(C10:C16). - Apply the formats used in rows 10-12.
- Match each campaign name with column
Bof the record log.
Why is a record missing from its campaign total?
First, check the record date and campaign name. Extra spaces, punctuation changes, or different wording can prevent a match. Capitalization alone ordinarily doesn’t affect SUMIFS.
Next, confirm that the date falls between B2 and D2. The formula criteria include both dates.
Why do calculated clicks differ from link clicks?
The report’s calculated click and CTR fields aggregate column K. Column L retains link clicks but doesn’t feed those calculations. Rename the calculated labels to Clicks and CTR so they agree with the source columns.
What does zero revenue mean for a lead campaign?
It can mean that no monetary value was assigned to the leads. Use the CPA rule so the campaign decision is based on cost per result instead of zero ROAS.
How should negative advertising adjustments be recorded?
This template assumes nonnegative daily delivery aggregates. Preserve the source export, confirm the adjustment policy, and restate the affected aggregate row. A negative reversal row requires redesigned and separately tested validation and decision logic.