
Sync an Excel Model With Deal Data Safely
Set up refreshable deal data in Excel, calculate pipeline forecasts, and validate each update with IDs and control totals.
Yes, Excel models can stay connected to deal data through a refreshable import. In this context, “sync” usually means refreshing imported records instead of retyping them. It doesn’t necessarily mean real-time updates or two-way CRM writeback.
This guide covers how to choose a connection method, calculate pipeline forecasts, and validate refreshed data. The worked example uses synthetic records entered manually. It demonstrates the model calculations, not a tested Excel, Power Query, or CRM connection.
What You'll Need
- Microsoft Excel with Power Query for refreshable imports; connector availability varies by platform and version
- A deal export with stable deal IDs
- Defined rules for deal amount, probability, and expected close date
- Copy the Sales deal tracker Google Sheets template or download the Excel file
Step-by-Step Guide
Choose how deal data reaches Excel
Start with the method that matches your reporting frequency and source-system requirements.
| Method | How updates reach Excel | Suitable use | Main limitation |
|---|---|---|---|
| Manual replacement | A user replaces the existing deal rows | Controlled, infrequent updates | The model is current only after the replacement |
| Refreshable import | Power Query retrieves data from a configured source | Recurring one-way updates | Importing data doesn’t establish CRM writeback |
| Two-way synchronization | A verified integration reads and writes records | Workflows requiring updates in both systems | Identity, conflict, deletion, and writeback behavior must be documented |
Microsoft documents imports from tables, workbooks, CSV files, and other supported sources through Power Query.
For a recurring CSV process, export the complete current deal list to a controlled location. Then, in Excel, select Data → Get Data → From File → From Text/CSV, review the preview, and load the data into a separate staging table.
Using a complete replacement extract makes missing deal IDs visible. By contrast, appending extracts without deletion logic can leave obsolete or duplicate deals in the model. For more information about workbook connections, see Excel IMPORTRANGE equivalents.
Define the required deal fields
At minimum, include these fields:
Deal ID: stable, unique text identifierClient: customer or prospectStage: controlled pipeline statusAmount: numeric deal value in a defined currencyProbability: decimal from 0 to 1Expected close: valid dateOwner: responsible person or team
Map each field by header name, not column position. Imported records should also remain separate from model calculations so a refresh doesn’t overwrite formulas.
Before accepting an update, confirm that IDs are present and unique. Amounts should be numeric and nonnegative, probabilities should range from 0 to 1, and expected-close values should be valid dates.
Build the pipeline calculation
The Deals sheet uses A11:H18 for synthetic deal records. Columns D, E, and F hold deal values, probabilities, and expected close dates. Column G is reserved for calculated weighted amounts, while column H contains the owner.
Enter these headers in A10:H10:
| A10 | B10 | C10 | D10 | E10 | F10 | G10 | H10 |
|---|---|---|---|---|---|---|---|
| Deal ID | Client | Stage | Amount (USD) | Probability | Expected close | Weighted amount | Owner |
Enter these illustrative records in A11:H18. Leave the Weighted amount cells in column G blank for now; place each owner in column H.
| Deal ID | Client | Stage | Amount (USD) | Probability | Expected close | Weighted amount | Owner |
|---|---|---|---|---|---|---|---|
| D-101 | Northstar Bakery | Discovery | $18,000 | 20% | =DATE(2026,10,20) | Ari | |
| D-102 | Cedar Works | Proposal | $32,000 | 55% | =DATE(2026,10,28) | Bo | |
| D-103 | Harbor Studio | Negotiation | $25,000 | 80% | =DATE(2026,11,12) | Chen | |
| D-104 | Juniper Market | Qualified | $12,000 | 30% | =DATE(2026,11,25) | Ari | |
| D-105 | Paper Kite Co | Proposal | $0 | 60% | =DATE(2026,12,5) | Chen | |
| D-106 | Maple & Main | Discovery | $21,000 | 0% | =DATE(2026,12,19) | Bo | |
| D-107 | Brightline Print | Negotiation | $40,000 | 70% | =DATE(2027,1,15) | Ari | |
| D-108 | Silver Fern Foods | Proposal | $16,000 | 45% | =DATE(2027,1,22) | Chen |
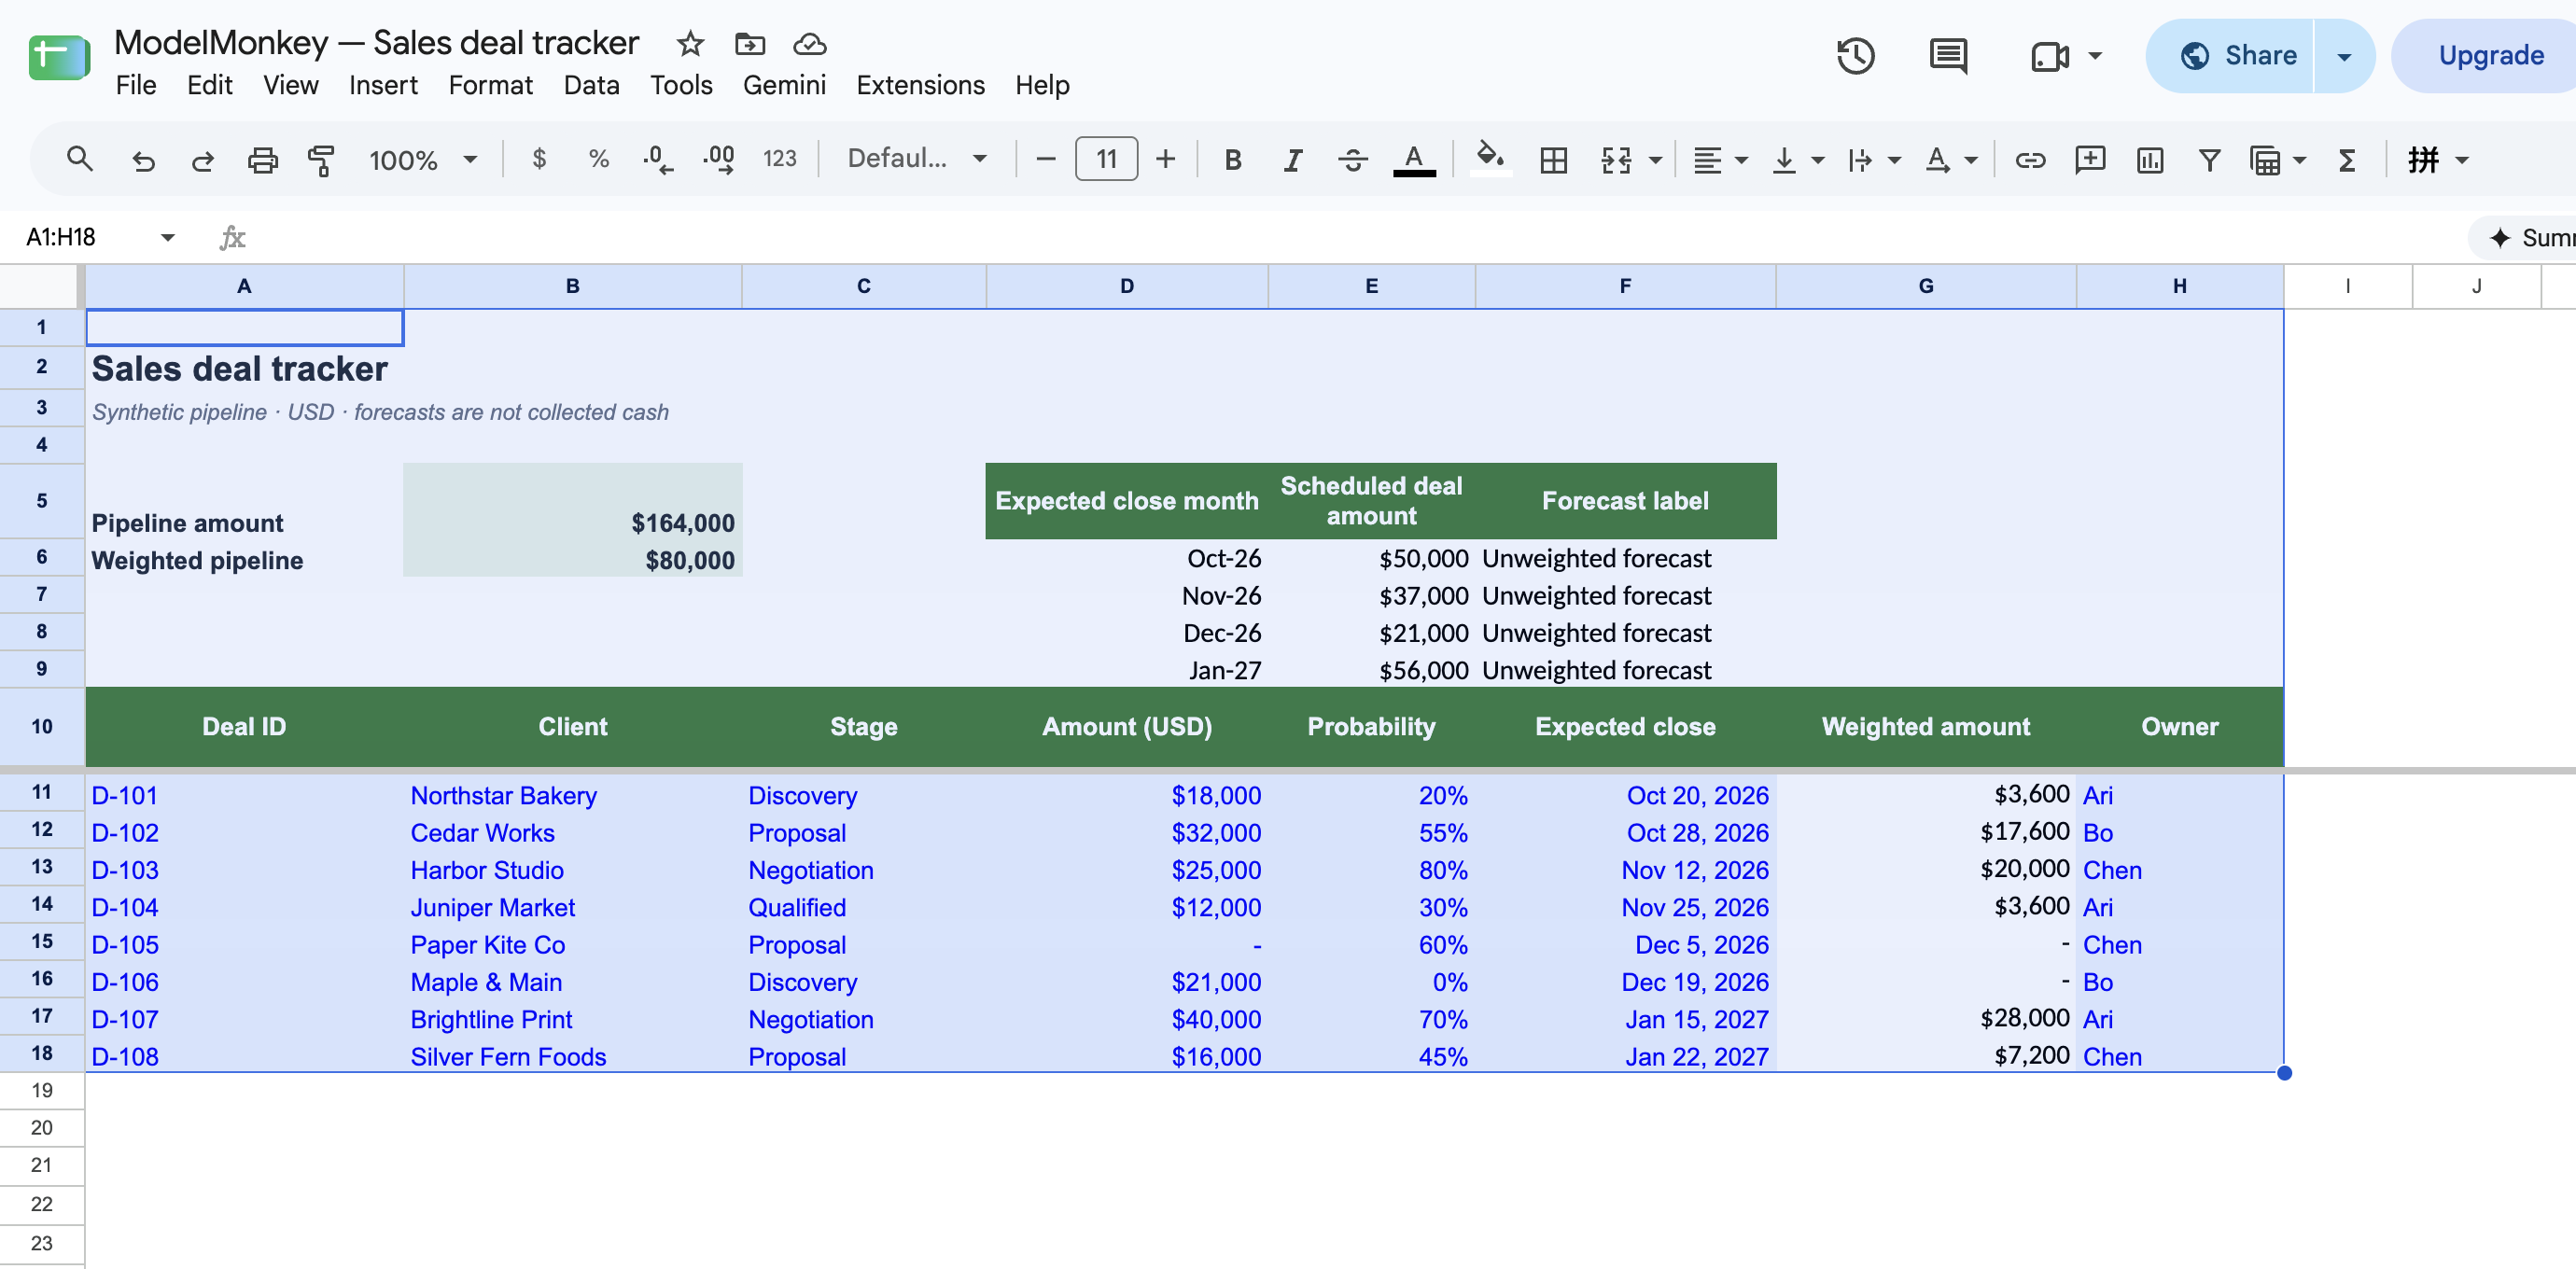
Actual Google Sheets screenshot of the restored synthetic example.
In G11, enter the weighted-amount formula and fill it through G18:
=D11*E11
For D-101, the calculation is $18,000 × 20% = $3,600.
Next, calculate total unweighted pipeline in B5:
=SUM(D11:D18)
Expected result: $164,000.
Calculate weighted pipeline in B6:
=SUM(G11:G18)
Expected result: $80,000.
A zero amount or zero probability produces a zero weighted amount. However, blank, nonnumeric, or out-of-range inputs require review and shouldn’t be treated as valid zeros.
Schedule unweighted deal amounts by month
Enter the month-start dates in D6:D9:
D6: =DATE(2026,10,1)
D7: =DATE(2026,11,1)
D8: =DATE(2026,12,1)
D9: =DATE(2027,1,1)
In E6, enter this formula and fill it through E9:
=SUMIFS($D$11:$D$18,$F$11:$F$18,">="&D6,$F$11:$F$18,"<"&DATE(YEAR(D6),MONTH(D6)+1,1))
The expected scheduled amounts are:
| Month | Cell | Unweighted amount |
|---|---|---|
| October 2026 | E6 | $50,000 |
| November 2026 | E7 | $37,000 |
| December 2026 | E8 | $21,000 |
| January 2027 | E9 | $56,000 |
Together, E6:E9 total $164,000, which reconciles to B5 because every deal falls within those months. The total doesn’t equal the $80,000 in B6: the monthly schedule uses full deal amounts, while B6 applies probabilities.
The formula includes the first day of each month and excludes the first day of the next month. A month without qualifying dates returns zero. Locales configured for semicolons may require semicolon argument separators.
Verify the zero-probability behavior
Change E11 from 0.2 to 0.
The recorded Google Sheets execution produced:
G11: $0B6: $76,400
D-101 remains in row 11. Its $18,000 value stays in B5, as well as October’s scheduled amount in E6. Only its weighted contribution changes.
Restore E11 to 0.2. The weighted pipeline in B6 returns to $80,000.
This execution evidence covers only the synthetic Google Sheets calculation. It doesn’t verify Excel execution, Power Query refreshes, or a vendor integration.
Validate every refresh
Before reporting refreshed results, confirm:
- The refresh completed without credential, path, missing-column, or type errors.
- Source and staging row counts agree.
- Deal IDs are populated and unique.
- New and missing IDs have explanations.
- Changes to stages, amounts, probabilities, dates, and owners are expected.
B5ties to the imported amount column.B6equals the sum ofG11:G18.- Monthly amounts reconcile to the applicable deal rows.
Remember that the formulas count every row, including duplicate IDs. They also don’t detect malformed values automatically.
ModelMonkey can inspect workbook context in Excel or Google Sheets and help analyze formulas, find data issues, organize ranges, or propose spreadsheet changes. For this workbook, a relevant request is:
Check
Deals!A11:H18for blank or duplicate deal IDs, probabilities outside 0-1, invalid dates, and formula errors. Then reconcileB5andB6.
Review the identified issues, proposed changes, and control totals before using the results. To reproduce the checks, copy the Google Sheets template or download the Excel workbook.
Wrapping Up
An Excel model can refresh imported deal records through Power Query or another verified connection. Still, an import alone isn’t two-way CRM synchronization. Preserve stable deal IDs, separate source data from formulas, and reconcile each refresh before reporting.
The $164,000 scheduled pipeline and $80,000 weighted pipeline are forecast measures. Neither represents recognized revenue, paid invoices, or cash received.
Frequently Asked Questions
Does Power Query provide two-way CRM synchronization?
No. Power Query can refresh an Excel-side table from a configured source, but that alone doesn’t provide CRM writeback, conflict handling, or bidirectional synchronization.
What happens when a deal has 0% probability?
Its weighted amount becomes zero. The deal remains in the source table, total unweighted pipeline, and expected-close schedule unless a separate rule excludes it.
Should a missing deal be retained at zero value?
Not automatically. Compare the current extract with the prior complete extract and determine whether the deal was closed, deleted, filtered, or omitted.
Are weighted and scheduled pipeline amounts cash forecasts?
Not without further assumptions. They measure potential deal value based on amounts, probabilities, and expected close dates. They don’t establish billing, revenue recognition, or collection timing.